Particle Image Velocimetry (PIV)
Aero development and research has become more and more important in a Formula One, especially after wind tunnel running hours has been restricted to reduce costs and allow for closer competition. Exploiting aerodynamic loopholes in the regulations became more and more important. Such feats can however only be achieved when engineers work closely together to find every little tenth of a second in a car. But for something like that you will need right equipment, and a wind tunnel has been indispensible since the 80's.
To achieve better efficiency, F1 teams realized that it would be extremely helpful to be able to measure and visualize flow fields quickly from wind tunnel tests. Newly developed Particle Image Velocimetry (PIV) system allowed technician to visualize air flow without introducing smoke stream in very sensitive air stream in front of testing subject. Smoke probe was efficient, but the whole problem in this area is how to visualize flow without introducing something new (smoke probe) into that flow that could potentially compromise the results. The appliance of PIV posed an excellent solution to this problem.
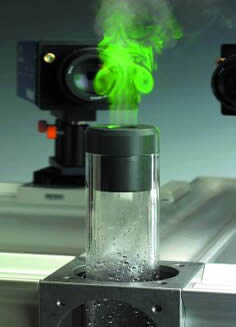
It will take wind tunnel about one hour of a start up time to come from stand still to a fully active PIV system. PIV system start up involves slowly filling the wind tunnel with a fog or mist of some kind, spreaded by a fog or mist generator. The fog generator is turned on while the tunnel starts running at low speeds. The most used chemical for fog generation is Di-Ethyl-Hexyl-Sebacat (DEHS) mainly because it is non-toxic, is liquid at room temperature and has nearly the same density as air. When the air flows through the tunnel, the small particles of DEHS that make up the fog simply float, making this PIV method as non-intrusive as possible. Fog generator is located in opposite side of the tunnel or inside honeycomb panels. Uniform spread of fog particles is of critical importance. Speed of the air is slowly increased to full or required speed. During this time, final checks are performed to ensure an accurate measurement.
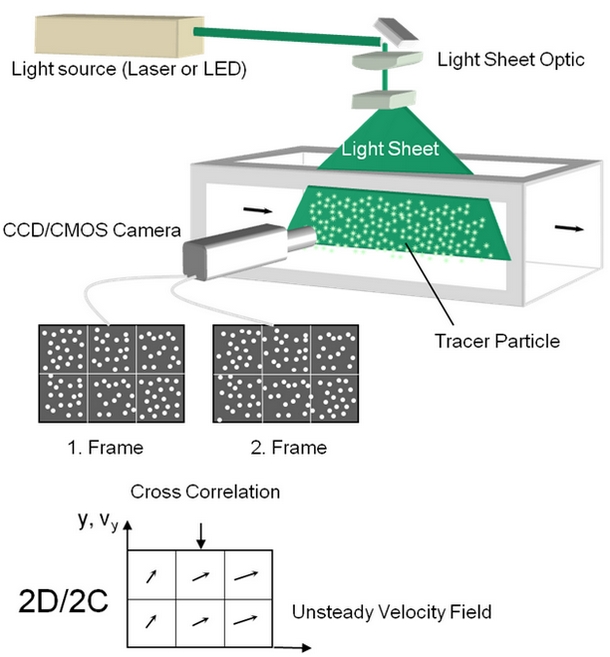
 Once the DEHS particles are evenly spread in the win tunnel, the camera is positioned at a 90-degree angle to the air flow field that needs to be tested. Next, engineers illuminate the part that needs to be visualized with a high-powered laser, creating a 2D plane. In the same time, a series of two-set photos are taken in extremely rapid intervals of two images taken 10-20 microseconds apart. Equipped with this sort of ultra-slow-motion digital imaging, engineers can easily view and measure the direction of the flow field and the rate of flow. PIV as a system also does not prevent wind tunnel engineers to run other tests at the same time as the PIV measurement is running.
Before a PIV test can run, special attention is required to prepare the model. Surface of the parts hit by the laser are specially prepared to reduce reflections. Position of the cameras must be calibrated first, and then the laser can be correctly positioned based on camera positions. For testing same subject (e.g. same Formula 1 car), cameras are permanently installed in the wind tunnel to get the laser sheet in the correct position. All the laser optics is mounted on traversing units, to be able to move the laser sheet to the measurement positions. This makes the set-up of the measurements quick and repeatable.
During the time the laser is active, lights are out inside the tunnel while an infra red 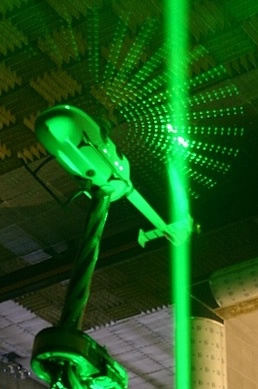 camera allows for the engineers to keep an eye on the model during testing. When everything is deemed ready for the test, the wind tunnel speeds up to the required testing speed, laser is fired up and images are recorded. At this time, it also easy to measure flow characteristics when the car is in a different configurations. Without requiring to go through all previous steps, the engineers can adjust the ride height of the car, change wind tunnel speed or change the front wing flap angle from the control room thanks to the model being rigidly attached to the movable wind tunnel pylon.
When the test has completed, DEHS gas completely evaporates after several hours, without leaving any trace on the model or the wind tunnel internals. Hence, regular wind tunnel testing can just continue, without requiring any cleanup whatsoever.
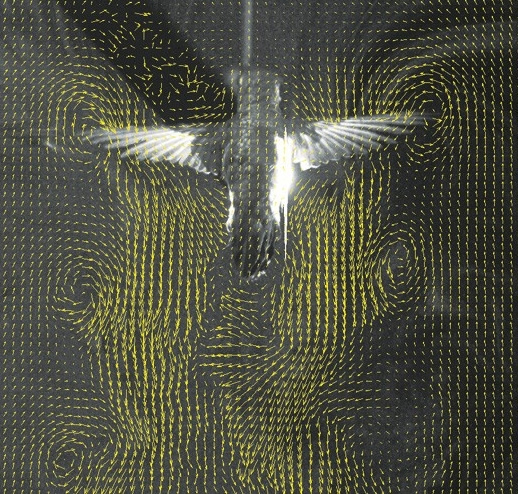
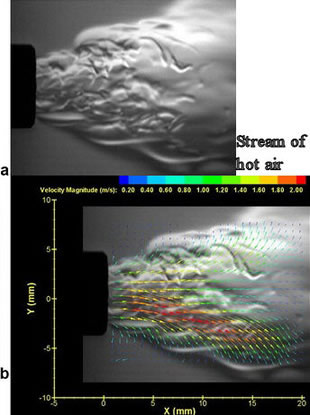
 After gathering the raw data from the PIV measurements engineers can plot the velocity magnitude and vorticity of certain area, and then compare the data sets to determine if their CFD methods are within acceptable accuracy ranges. The result of the CFD computations was then imported into CFD software to create the same picture as with the PIV data. They can alter the CFD methodology based on these observations, import the new results into software, created another CFD pictures and compare it with the PIV results to evaluate their progress. The process can be repeated until they arrive at an optimal design. Whenever necessary, the engineers can tweak the CFD process to get it closer to the wind tunnel results.
In its F1 days, PIV proved vital to improve the correlation between modeled airflow simulation through CFD and real world testing in the wind tunnel or on a track. It allows for engineers to rely on the CFD results to validate or improve the design of a component.
Back to the top of the page